There can never truly be a Golden State Warriors type team in the National Hockey League (sorry David Staples) but the San Jose Sharks, upon acquiring the services of Erik Karlsson, kind of had that feel.

Through the first 24 games, however, the Sharks find themselves sitting in 2nd place in the Pacific Division and 6th place in the Western Conference. That might not sound too bad, but given the expectations heading into the season, and the way the Sharks have competed, the team likely believes they should be in a better position and they’re probably right. However, recent trends suggest that the team might not be heading in the right direction. I’ll be using 5-on-5 Score and Venue statistics via Natural Stat Trick and visuals courtesy of Sean Tierney to look into what exactly has changed.
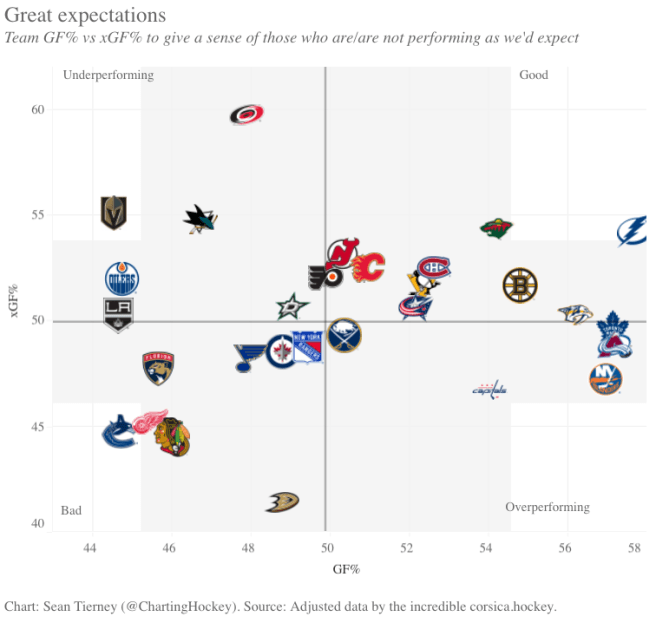
As you can see, we’re about a third of the way through the Sharks season, and they’ve underperformed according to Corsica Hockey. Theoretically, the Sharks should have scored approximately 55 percent of the goals during 5-on-5 play thus far, yet they’ve only managed to score about 47 percent of the goals in actuality. Are the Sharks just unlucky, or are they being held back by other forces?
Well, goaltending is an issue. When the Sharks signed Karlsson, the team looked so good on paper, that I wondered if this would be the season that Martin Jones would be correctly labeled as a weak link and it looks like that could be unfolding before our very eyes.
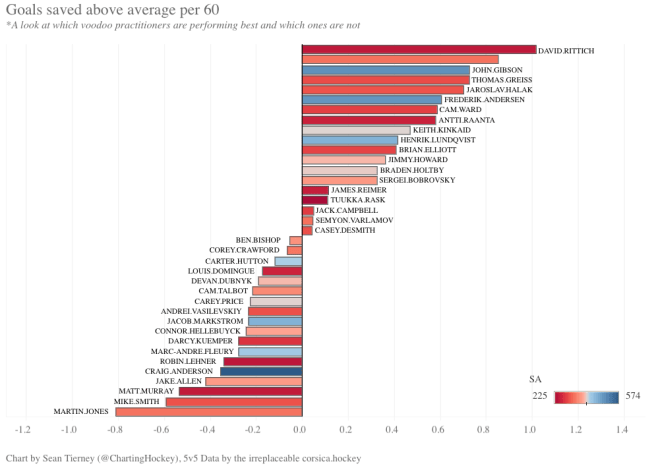
Aaron Dell, the Sharks backup goaltender, in my opinion, is the better of the two goaltenders, but Peter Deboer and the rest of the Sharks brass apparently haven’t figured it out yet because Dell has only started a third of the games and hasn’t really been able to make a difference. For the Sharks, running with Dell and hoping that he performs at a high level, is probably the only alternative to Jones. Martin Jones is overrated, though, (a run to the Stanley Cup can do that for a goaltender) so it’s unlikely that a permanent switch will be made.
Aside from goaltending, though, the Sharks have flirted with mediocrity recently, and while they seem to be trending in the right direction — at least in terms of their expected goal differential — I’m still left wondering if a lack of success has led this team to alter their approach. If that’s the case, it could be troublesome, because the way the Sharks were playing probably would’ve paid off in the longterm had they stuck to it.

As I mentioned, the Sharks have played 24 games, and I like symmetry, so we’re going to look at the 12 game splits. It also kind of works in the sense that, somewhere around the end of October and the beginning of November, things started to change — it seems — for the Sharks. Is it the best way to analyze a team’s performance? Of course not, but I’m not trying to get hired by an NHL team, I’m simply looking to ask some questions here.


In hockey, when a coach implements a system — or a process — and the players attempt to execute it, what kind of immediate feedback do they get on whether they’re doing things the right way or the wrong way, or should I say, what kind of feedback do they value? Well, wins and losses are probably high on list. So are goals and goals against, and that’s the problem. The feedback that coaches and teams get on whether or not they’re doing things the right way is often not very helpful because hockey is so influenced by luck. This can create problems. If a team is playing in a seemingly optimal way, and not seeing the results that they would like to see, they might be persuaded to change their approach. Often times, it’s not for the better, and teams are simply fooled by variance.
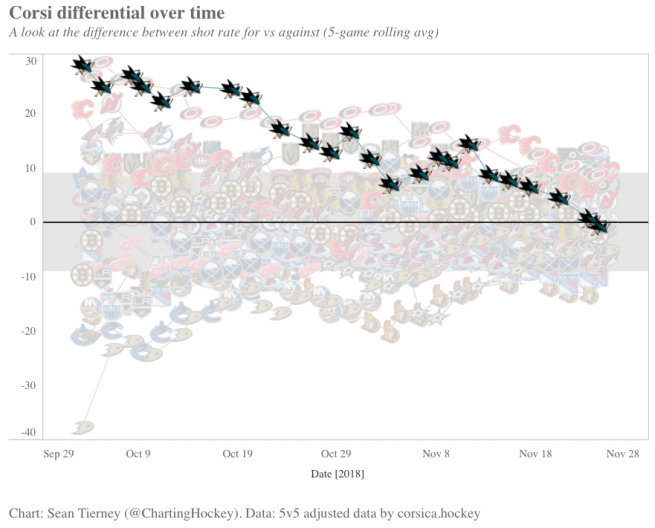
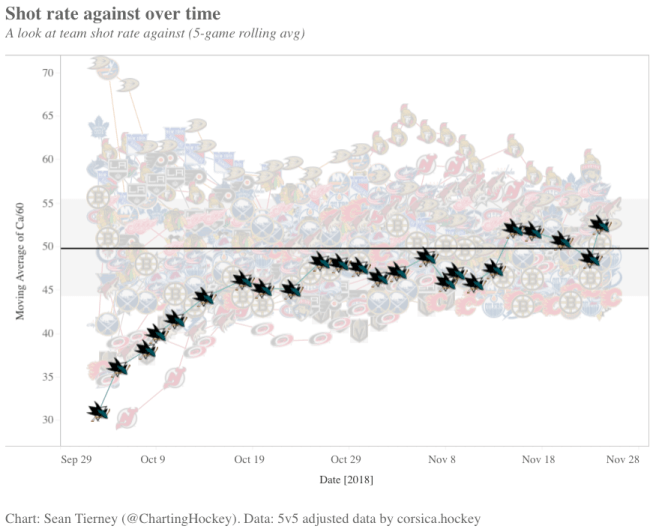
You have to question if that is what is happening in San Jose right now. We’ve seen how the Sharks 5-on-5 expected goal share has drifted from great to good, and a 5-game rolling average of the teams 5-on-5 corsi differential tells a similar story except there hasn’t been signs of a resurgence.
Through the first 12 games of the season, the Sharks posted a 5-on-5 corsi for percentage of 59.9. The team was generating almost 74 shot attempts per 60 minutes at 5-on-5 and allowing less than 50. Similarly, the Sharks also attempted high danger shots at a rate of almost 15 per 60 minutes, and did a decent job limiting the opposition to about 10 per 60 minutes. That was good for high danger corsi for percentage of 59.4, but despite all of their good work, the Sharks only scored 49.3 percent of the 5-on-5 goals in those 12 games and that’s when it seems the Sharks started to do things differently.
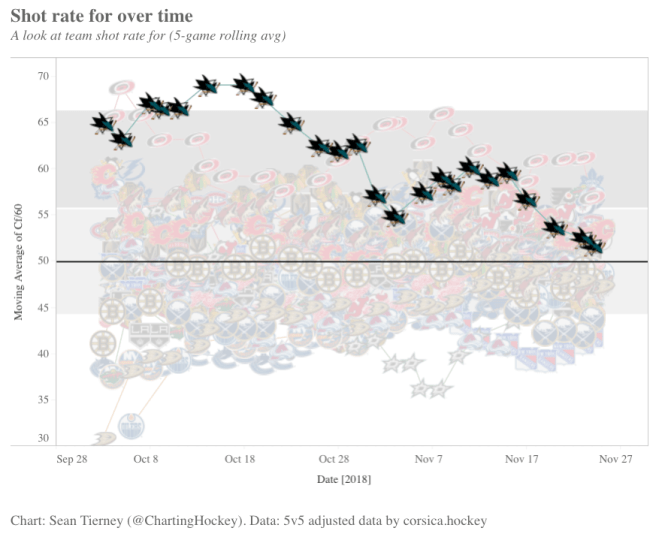
In the 12 games since Halloween, the Sharks have been attempting shots and chances at a much lower rate. The team has attempted roughly 61 shots per 60 minutes and about 12 high danger shots per 60 minutes at 5-on-5.
Are the Sharks attempting more cross ice passes? In other words, are they taking fewer shots in an effort to make opposing goaltenders move side to side more frequently? I don’t know, but whatever the case may be, the Sharks have not been scoring goals at a higher rate.
The Sharks scored 2.55 goals per 60 minutes at 5-on-5 in the month of October. In the moth of November, the team has scored 5-on-5 goals at a rate of 2.46 per 60 minutes. In the high danger area, the Sharks were scoring goals at a rate of 1.46 per 60 minutes through the first 12 games, and that number has dipped to 1.38 in the time since.
If the Sharks have changed their offensive approach, it hasn’t paid immediate dividends, and it looks far less threatening than it did.
On the other side of the puck, the Sharks have not been limiting shots at as low of a rate as they had been, allowing 55.6 shot attempts against per 60 minutes at 5-on-5 and, naturally, the team has also been allowing more high danger chances than in the previous stretch of games.
This has resulted in the Sharks allowing goals at a far higher rate as of late. At 5-on-5, the team was scored on at a rate of 2.63 goals per sixty minutes during their first 12 games but have seen their goals against per 60 minutes climb to 3.12 in the last 12 games. And while the rate at which the Sharks have been allowing high danger shots against hasn’t increased significantly, the rate at which opponents have been converting on those shots has. In the last 12 games, the Sharks have allowed high danger goals at a rate of 2.19 per 60 minutes, substantially higher than the 1.53 rate that opponents scored those types of goals at in the first 12 games.
All in all, combined with the apparent change in the Sharks offensive approach, the team has owned a 52.5 percent of the shot attempts and 50.8 percent of the high danger chances at 5-on-5 since the calendar flipped over to November. They’ve also owned even less of the 5-on-5 goal share than they did before, with a 44.3 goals for percentage.
Could this be because the team had a tougher schedule in November than they did in October? I don’t believe so. As far as competition goes, it’s been a rather light schedule with a healthy dose of a few talented teams mixed in throughout. On top of that, the Sharks actually played 8 of their first 12 games on the road, and 9 of their next 12 at home, which makes this even more confusing.
With a little over two thirds of the season left to be played, it seems there are several questions that should be asked about the Sharks moving forward.
Is there a coaching issue? Has Deboer been tuned out due to a lack of production? In other words, are the players dictating these changes themselves, or has Deboer made alterations to the Sharks game plan himself? I don’t like to speculate on this sort of thing as I have no idea what the locker room is like and I am in no way an expert on any particular team system, but it at least has to be considered.
Is it time that Dell takes over the crease, leaving Jones to take his rightful place on the bench? And if that’s the case, which I think it is, are the Sharks simply too in love with this goaltender? Is the organization falling victim to sunk cost fallacy? Jones has posted a 5-on-5 save percentage of .879 and frankly, he’s a big reason why the Sharks are not in a better position. If the organization continues to give Jones the majority of the starts, it could very well be their downfall.
Now, in no way am I suggesting that the San Jose Sharks are not one of the best teams in the National Hockey League, but recent trends are cause for concern, in my opinion, and it’ll be interesting to see how the Sharks peripherals look in the coming weeks.
